
This project leverages Python for data analysis and visualization to explore streaming content trends and viewer preferences. By analyzing streaming data, the project reveals key insights into content popularity and audience engagement through basic Python visualizations. Discover what drives viewer choices and engagement.
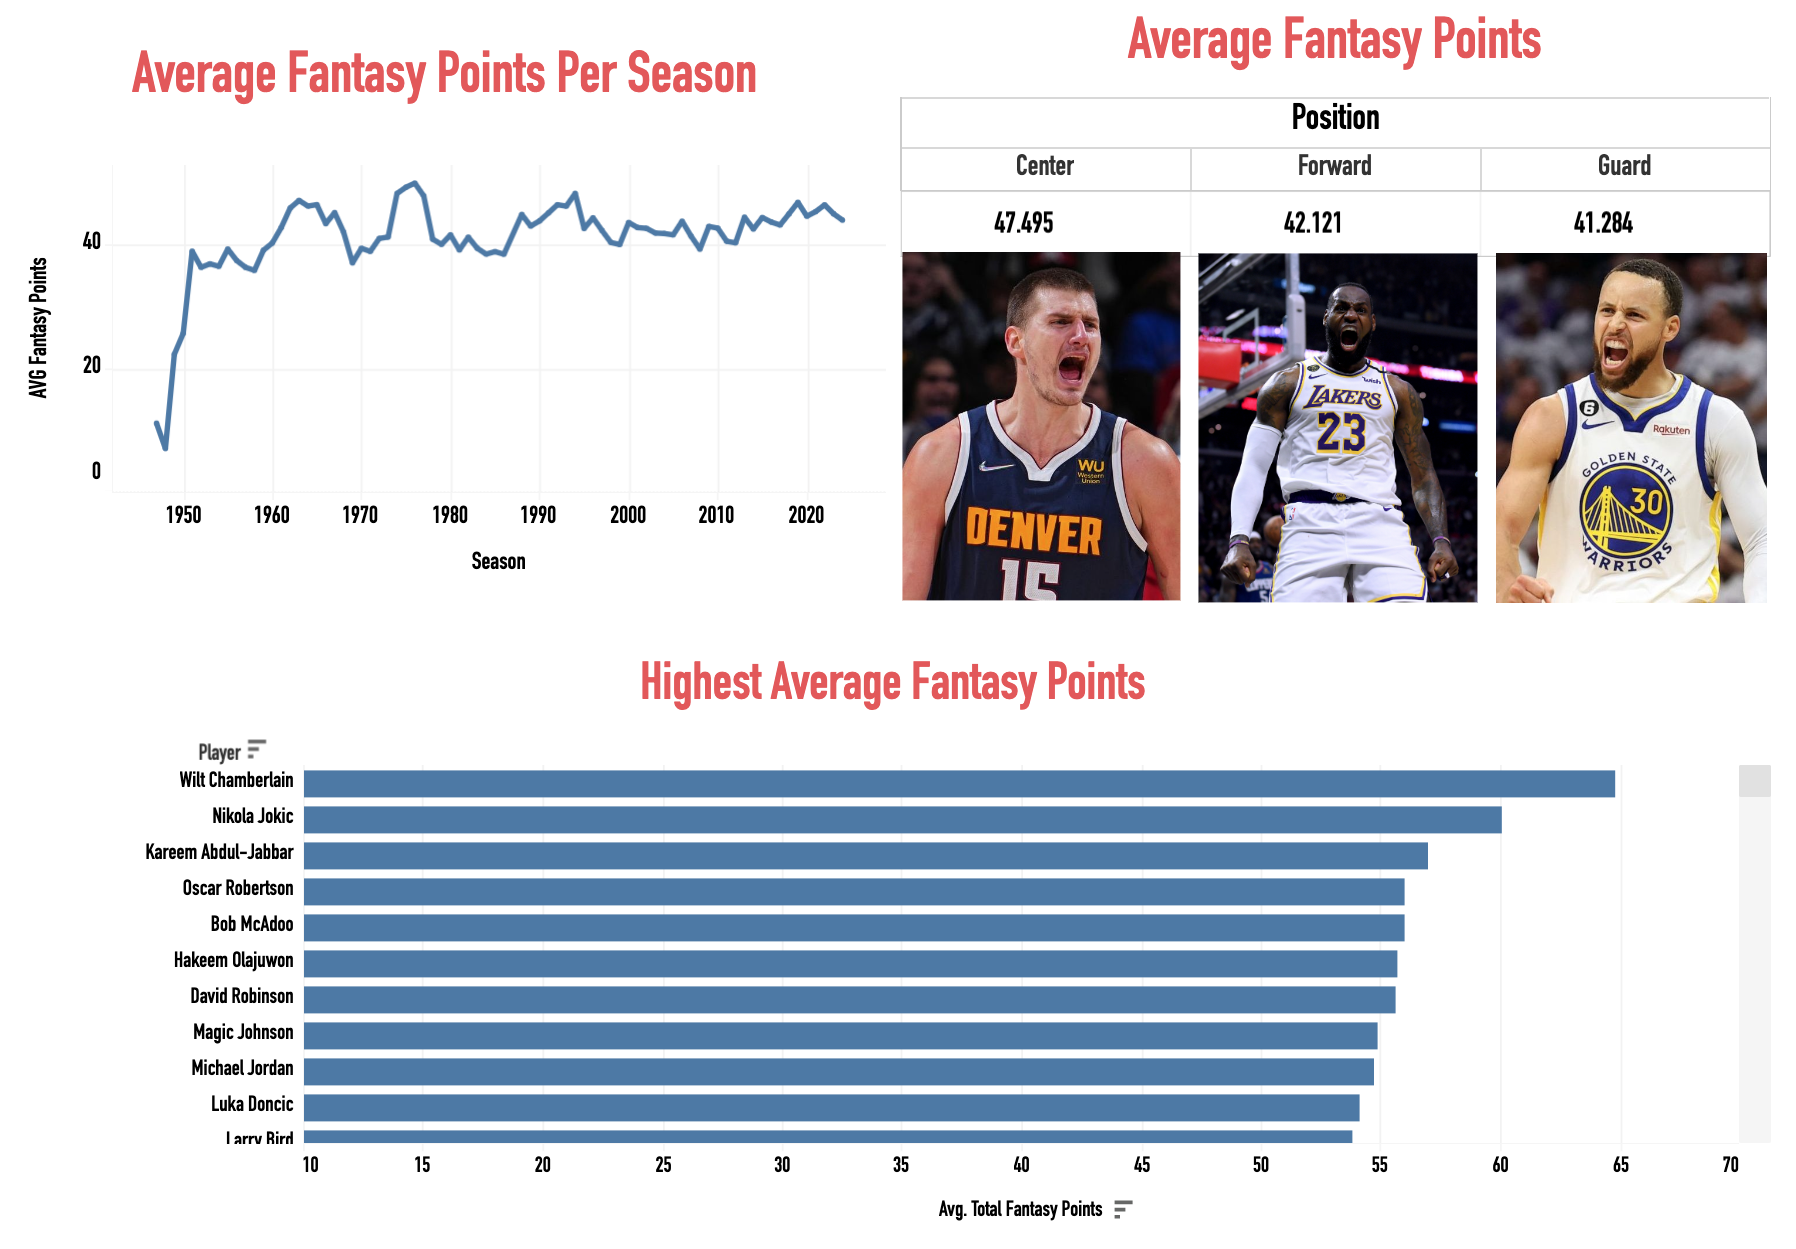
Analyze NBA player stats using SQL, Excel, and Tableau to create a personalized fantasy points system. Explore interactive dashboards with insights on player performance.

Standardize date formats, fill missing addresses, and remove duplicates in a fictional Nashville real estate dataset using SQL queries, preparing it for further analysis.
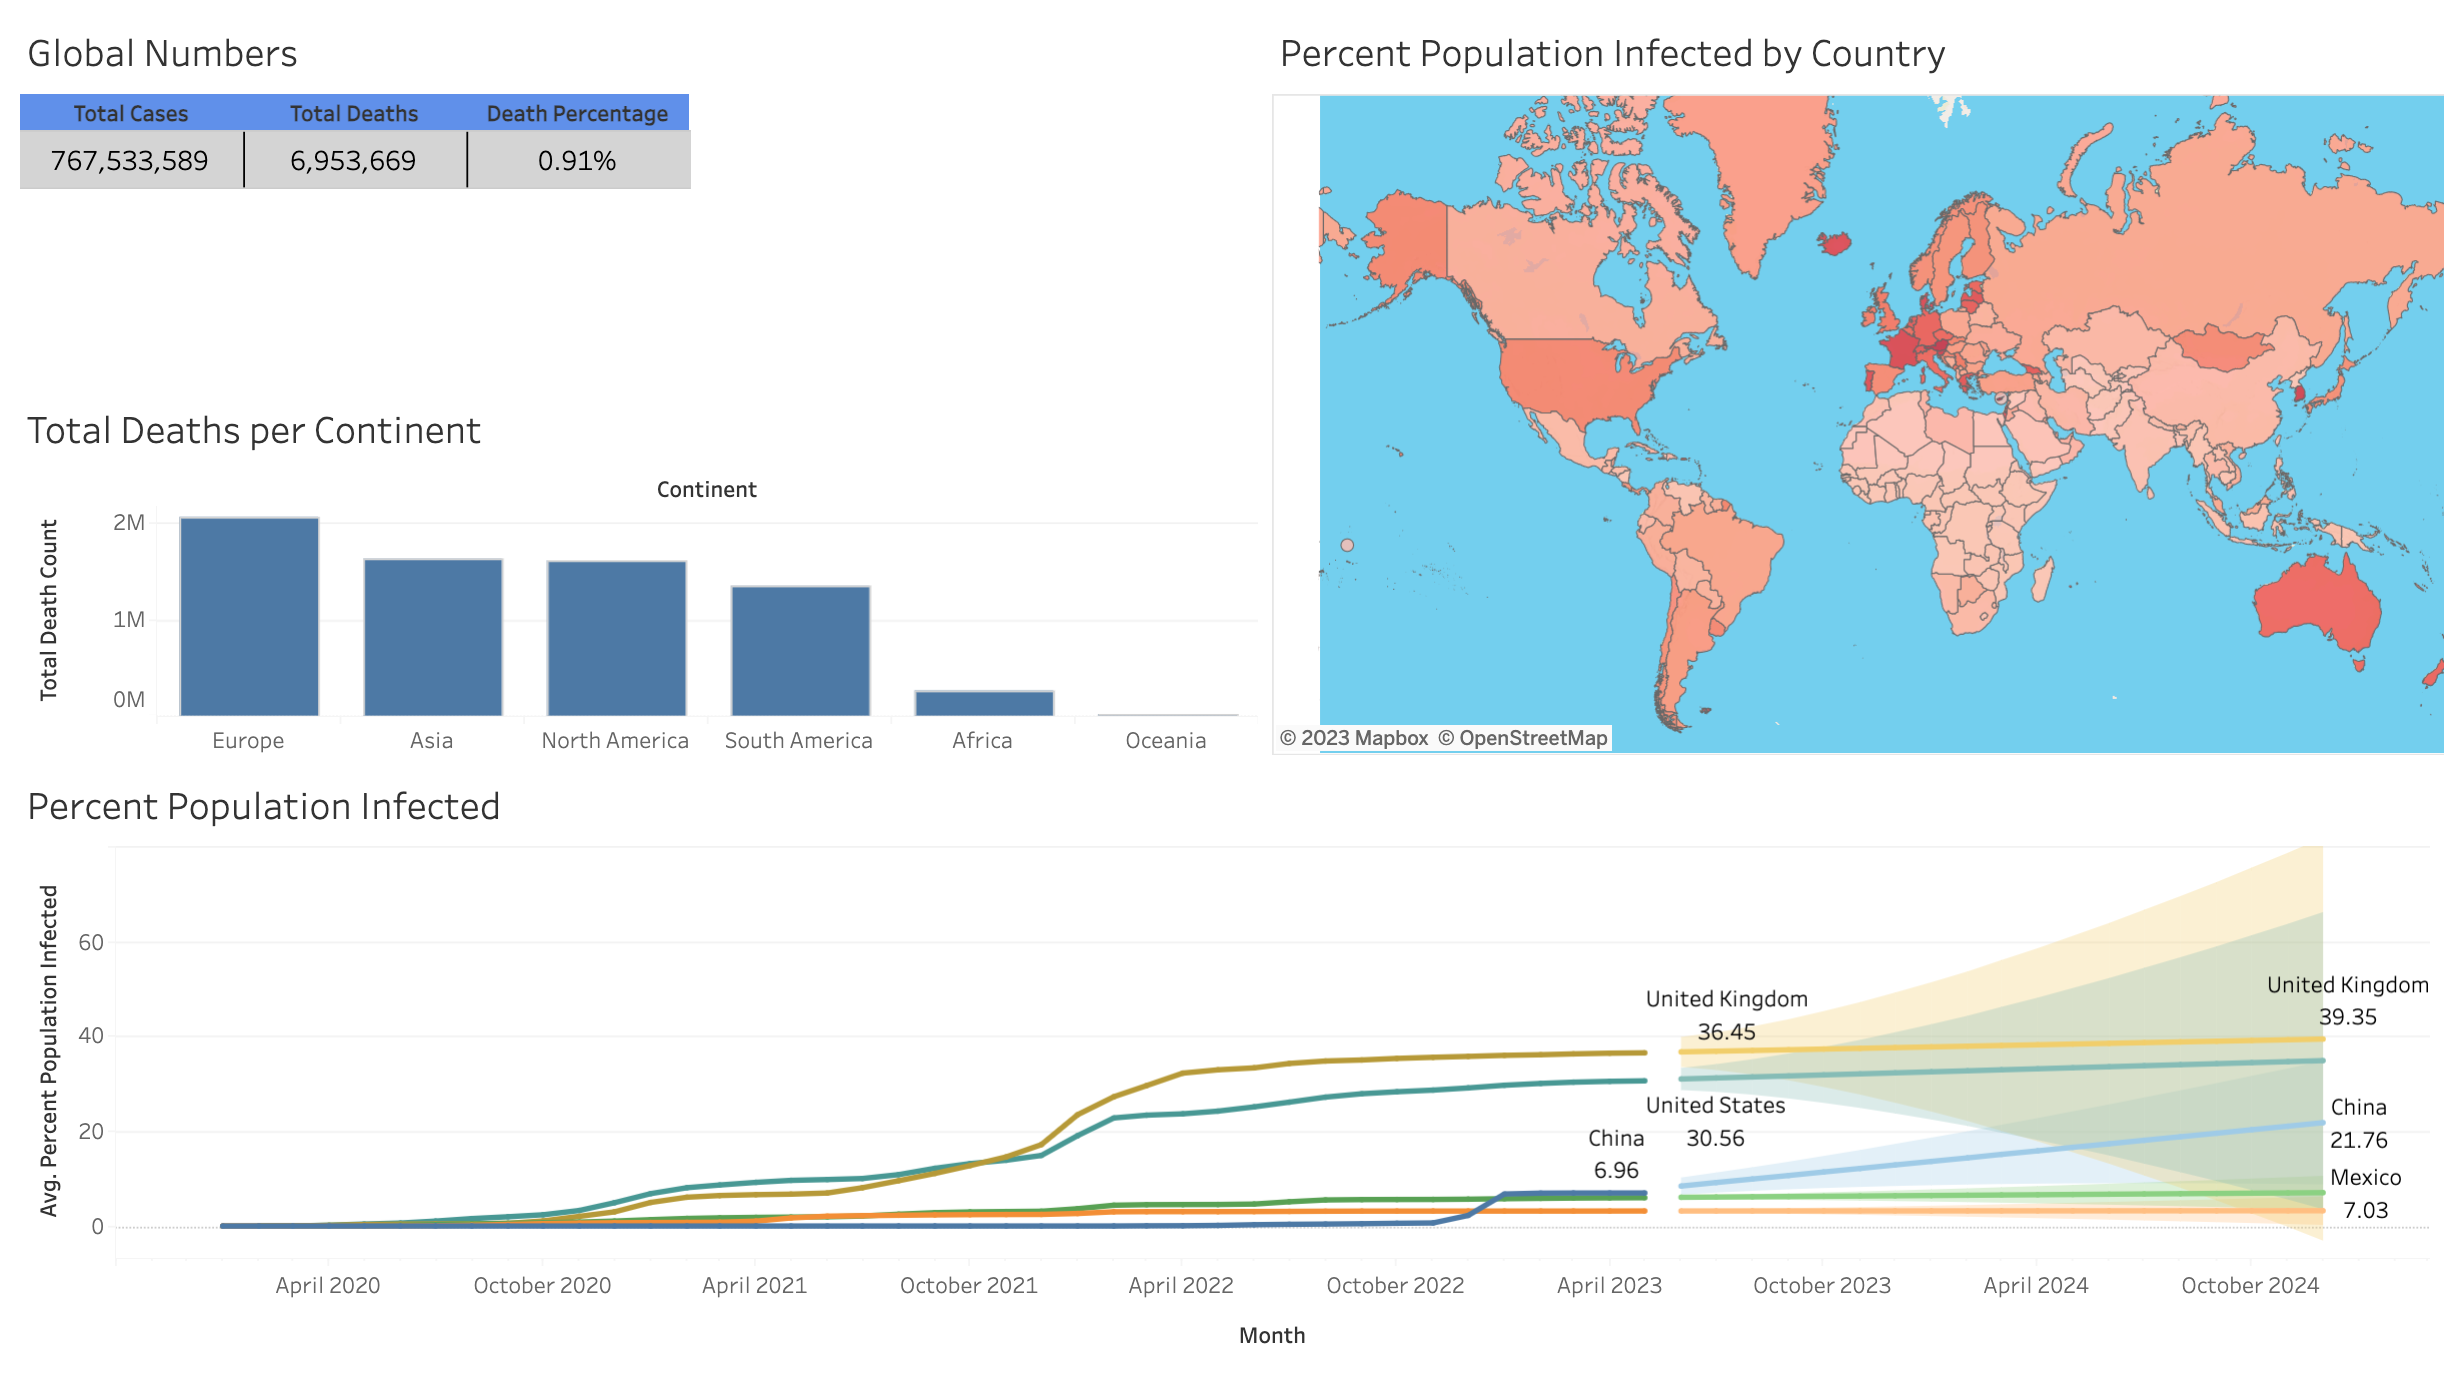
Analyze global COVID-19 data using SQL, revealing trends in infection rates, death percentages, and the relationship between population and vaccinations.

Tableau Portfolio that displays the dashboards and visualizations I have created.

Analyze bike-sharing data using R, comparing bike usage between members and casual riders through data wrangling and visualization techniques.

Use pandas to analyze sales data, focusing on sub-category profits and sales, with an in-depth look at bookcases across different regions and time periods.